 Smart-Hint
目次
チップ価格のサンプルデータとは?

今回紹介する「レストランのチップ価格」のサンプルデータは、非常に分かりやすいシンプルなデータです
Pythonのグラフ可視化や機械学習の練習に活用することができます
日本には「チップ」の文化はありませんが、海外旅行などで経験があるのではないでしょうか?
このチップですが、レストラン(従業員)側からすると重要な収入源です
どの顧客が多く払ってくれるのか、いつのタイミングが良いのかなど分析することができます
事前準備
seabornからサンプルデータを取得しましょう
import pandas as pd
import seaborn as sns
df = sns.load_dataset('tips')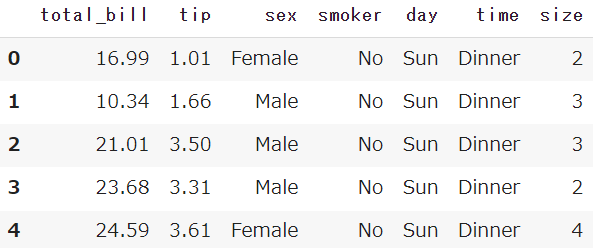
データ内容のご紹介
本データは特定レストランにおいける、1テーブルごとのお会計(チップ)に関するデータです
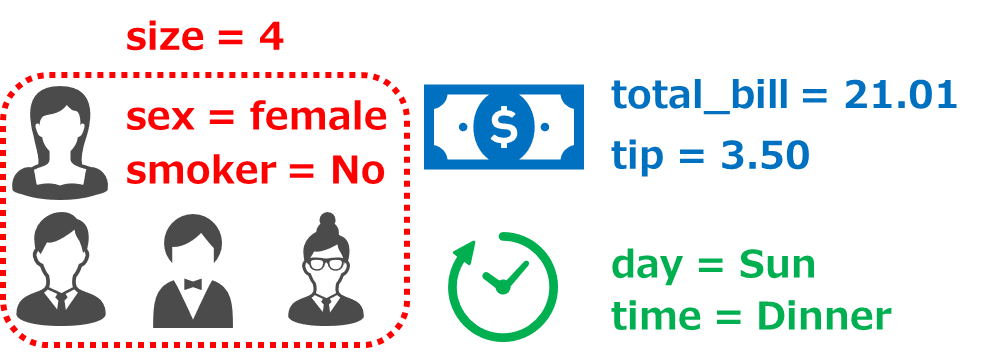
支払総額(total_bill)
total_billは支払い総額を示しています
単位がUSドルなのでご注意ください
後述しますがチップは支払い総額が大きく影響するので、重要な要因です
sns.histplot(data=df, x='total_bill')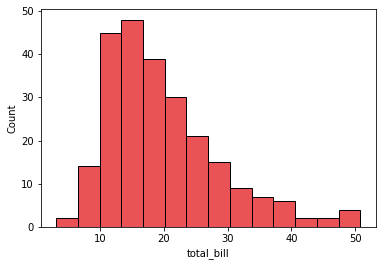
チップ(tip)
tipは本データの主役で、レストラン側に支払うチップです
sns.histplot(data=df, x='total_bill')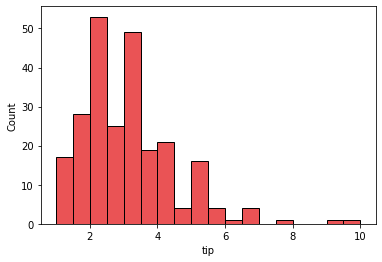
欧米の文化ではレストランのチップは、支払い総額の「15~20%」と言われています
今回のデータでもどのくらいの割合なのか算出してみると、平均「16%」という結果でした
temp['percentage'] = (df['tip']) / (df['total_bill']) * 100
print(temp['percentage'].mean())
sns.histplot(data=temp, x='percentage')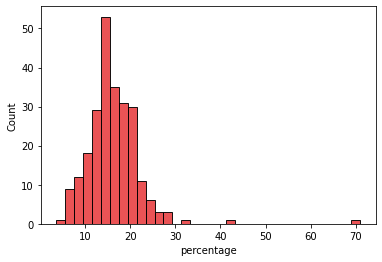
性別(sex)
sexは支払いを行った人の「性別」です
男性の方が若干、チップの支払いが多いことが分かります
sns.barplot(data=df, x='sex', y='tip')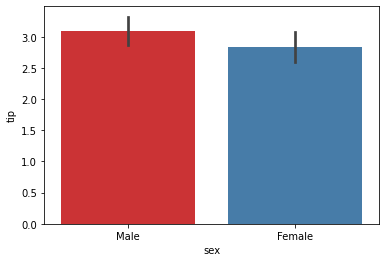
喫煙者(smoker)
smokerはグループの中に「喫煙者」がいるかどうかを示しています
「性別」と「喫煙者」でヒートマップを作ってみます
smoker_sex = df.pivot_table(index='smoker', columns='sex', values='total_bill', aggfunc='count')
sns.heatmap(smoker_sex, annot=True, cmap='Blues')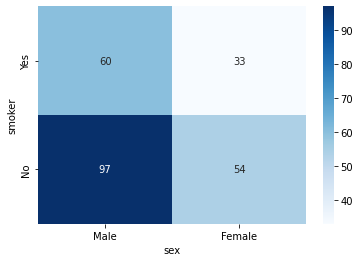
曜日(day)
dayは「曜日」を示しています
営業日の影響なのか、「木・金・土・日」の4日のみです
sns.barplot(data=df, x='day', y='tip')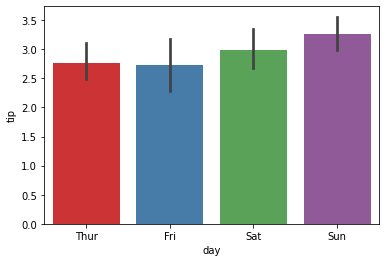
time(ディナーかランチ)
timeは食事を行った時間帯ですが、要は「ディナー」か「ランチ」のどちらかです
ディナーの方が支払総額やチップは高くなります
sns.barplot(data=df, x='time', y='tip')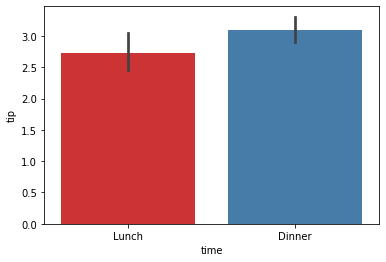
size(人数)
sizeはグループの人数です
1人の利用から、6人のグループの利用があります
sns.barplot(data=df, x='size', y='tip')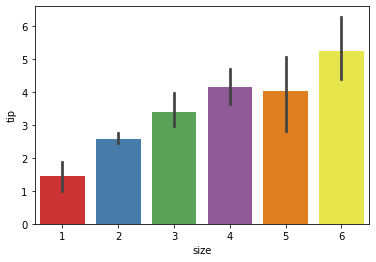
まとめ
今回は「レストランのチップ価格」のサンプルデータをご紹介してきました
サンプルデータにしては項目も少なく、非常にシンプルな項目しかありません
ぜひseabornの可視化や機械学習の回帰モデルの分析に利用してみてください
 【Python】初心者向けタイタニック号のサンプルデータをご紹介します
 【Python】ボストン住宅価格のサンプルデータをご紹介します