
目次
クロス集計表を作成する
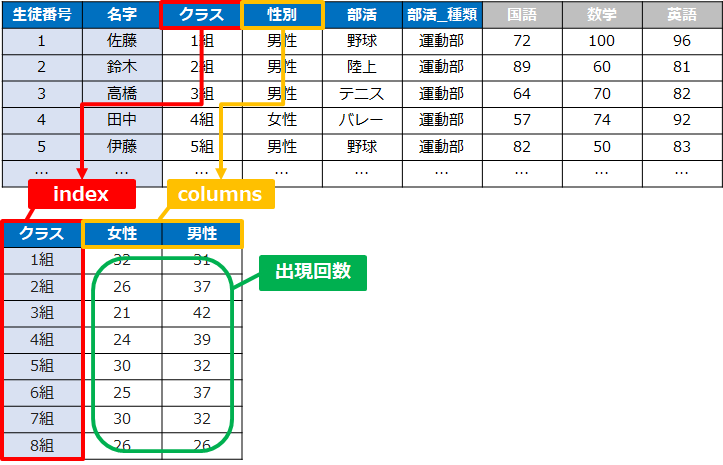
今回ご紹介するcrosstab()は、2つ以上のカテゴリーデータを行(index)・列(columns)に配置し
それぞれの出現回数を抽出することができます
似た関数にpivot_table()がありますが、大きな違いは抽出する項目です
crosstabはカテゴリーごとの出現回数を抽出するのに対し、
pivot_tableは平均・合計・最大など「計算」して抽出します
こちらの記事も合わせてご覧ください
 【Python】Pythonピボットテーブルを完全攻略|pivot_table
 事前準備
「Pandas」というデータ解析を実施できるライブラリをインポートします
import pandas as pd※サンプルデータ:学校のテストの点数

student.head()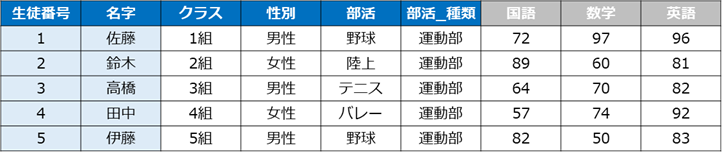
crosstabの使い方
crosstab()では始めに記載するDataFrameの列(第一引数)がindexとなり、
2番目に記載するDataFrameの列(第二引数)がcolumnsとなります
指定方法がpivot_table()と大きく異なるため注意してください
pd.crosstab(student['クラス'],student['性別'])![pd.crosstab(student['クラス'],student['性別'])](https://smart-hint.com/wp-content/uploads/2021/05/image-17.png)
パラメータ
おすすめ度を判定:★★★=必須|★★☆=推奨|★☆☆=任意
★★★:index(列:インデックス)
pd.crosstab(student['クラス'])indexにはクロス集計表の「インデックス」となる、DataFrameの列名を記載します
※index = ‘列名’という記述方法ではなく、DataFrameの列をそのまま記述するので注意しましょう
★★★:columns(列:インデックス)
pd.crosstab(student['クラス'],student['性別'])columnsにはクロス集計表の「カラム」となる、DataFrameの列名を記載します
※columns = ‘列名’という記述方法ではなく、DataFrameの列をそのまま記述するので注意しましょう
※複数列を指定する方法
index・columnsのそれぞれに複数列を指定することができます
その際はマルチインデックス・マルチカラムとなり、階層構造になります
[ ]リストでDataFrameの列を記述します
pd.crosstab([student['性別'],student['部活_種類']],student['クラス'])![pd.crosstab([student['性別'],student['部活_種類']],student['クラス'])](https://smart-hint.com/wp-content/uploads/2021/05/image-18.png)
indexに性別(女性・男性)と部活の種類(文化部・運動部)を設定しています
★☆☆:margins(総計)
pd.crosstab(student['クラス'],student['性別'],
margins='True')marginsを「True」で設定することで、総計を表示することができます
![pd.crosstab(student['クラス'],student['性別'],margins='True')](https://smart-hint.com/wp-content/uploads/2021/05/image-19.png)
★☆☆:margins_name(総計の名前)
pd.crosstab(student['クラス'],student['性別'],
margins='True', margins_name='合計')上記で設定したmarginsの名前を指定することができます。
margins_nameを指定しない場合は「All」となります
![pd.crosstab(student['クラス'],student['性別'],margins='True', margins_name='合計')](https://smart-hint.com/wp-content/uploads/2021/05/image-20.png)
★☆☆:normalize(全体を1とした集計)
pd.crosstab(student['クラス'],student['性別'],
normalize=True, margins=True)normalizeを「True」と指定することで、すべての値を合計で割って正規化します。
すべて合計した結果(margins)を1として、それぞれの項目を相対的に割り算していきます
前述したmarginsを設定しておくと全体の数値が分かります
![pd.crosstab(student['クラス'],student['性別'],normalize=True, margins=True)](https://smart-hint.com/wp-content/uploads/2021/05/image-21.png)
またnormalizeを「index」と設定すると、行ごとに合計すると1となるように集計されます
pd.crosstab(student['クラス'],student['性別'],
normalize='index', margins=True)![pd.crosstab(student['クラス'],student['性別'],normalize='index', margins=True)](https://smart-hint.com/wp-content/uploads/2021/05/image-22.png)
同様にnormalizeを「columns」と設定すると、列ごとに合計すると1となるように集計されます
pd.crosstab(student['クラス'],student['性別'],
normalize='columns', margins=True)![pd.crosstab(student['クラス'],student['性別'],normalize='columns', margins=True)](https://smart-hint.com/wp-content/uploads/2021/05/image-23.png)
- normalize = False(正規化なし:実数)※デフォルト
- normalize = True(全体を合計すると1になる)
- normalize = ‘all’(全体を合計すると1になる)※Trueと同じ
- normalize = ‘index’(行ごとに合計すると1になる)
- normalize = ‘columns’(列ごとに合計すると1になる)
まとめ
今回はcrosstab()の使い方についてご紹介してきました
2つ以上のカテゴリーデータの出現回数を抽出することができます
簡単にクロス集計表を作ることができるので、ぜひ試してみてください
また平均や合計などの関数を用いた集計をしたい場合はpivot_table()を使いましょう